Server monitoring
Introduction
Server monitoring allows you to track the current state and performance of your server in real time or over a specific period.
Regular monitoring helps to:
- Detect performance issues in time
- Optimize server resources
- Prevent critical situations caused by disk or memory overuse
Viewing current statistics
FASTPANEL® provides convenient tools to control key server performance parameters such as CPU load, RAM usage, and disk space usage. It displays key server performance indicators at the top of the control panel, in the upper-right corner of the interface.
In real time, the following data are available:
-
CPU load — current processor load percentage
-
RAM usage — amount of used and total available memory
-
Disk usage — used and total disk space
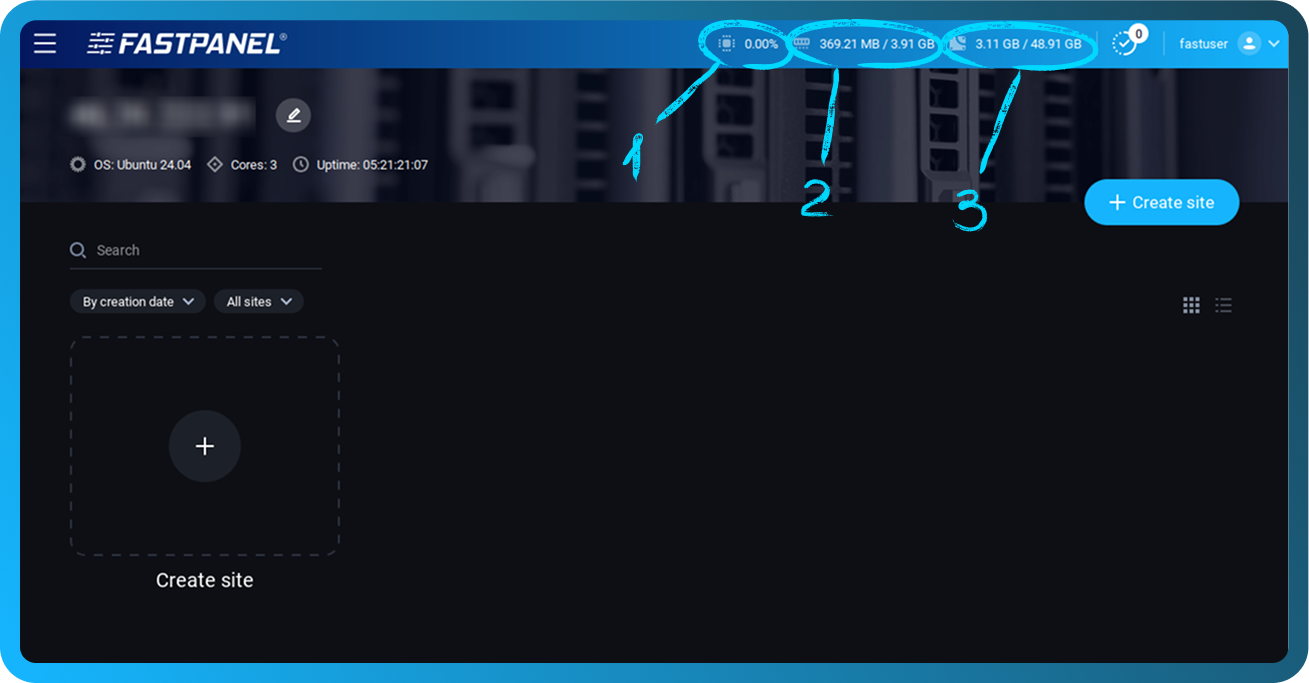
These indicators allow you to quickly assess the current server state without opening a separate section.
Detailed server statistics
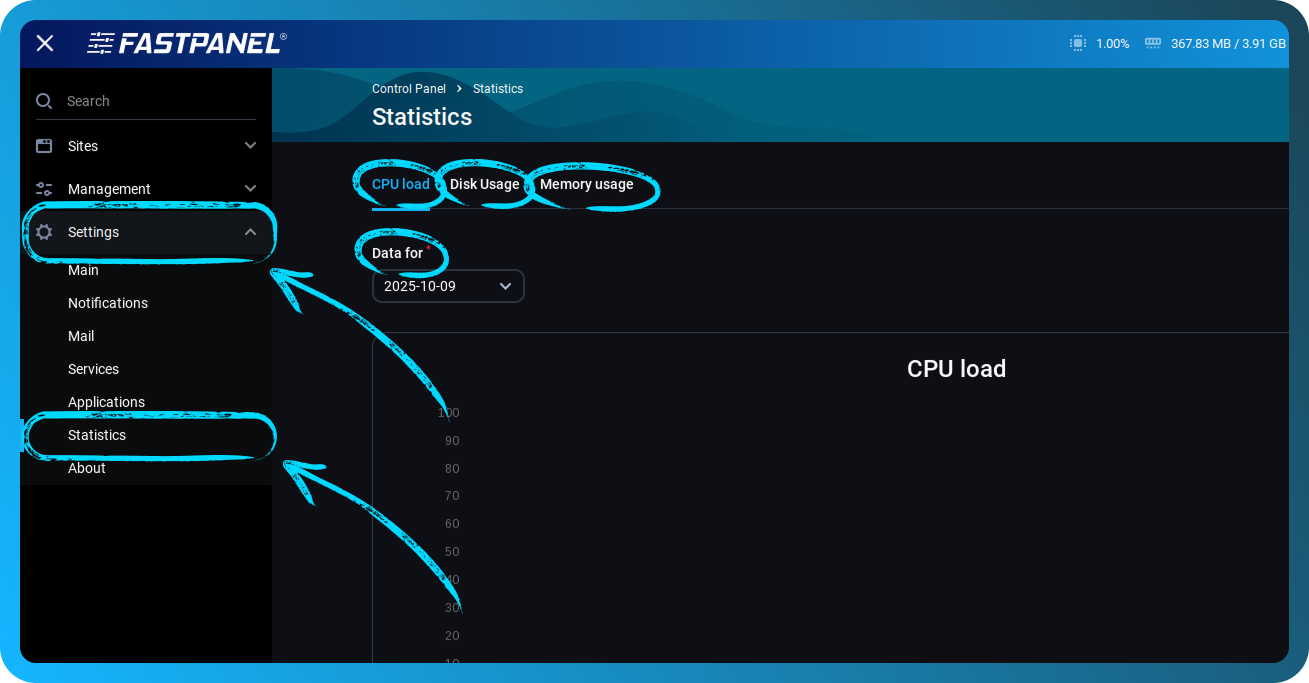
For a deeper analysis of server performance, use the "Statistics" section.
To open the "Statistics" section, go to the side menu → "Settings" → "Statistics"
This section contains three tabs with detailed charts:
-
CPU Load
-
Disk Usage
-
Memory Usage
At the top of the section, there is a dropdown menu labeled "Data for”, which allows you to select the period for displaying statistics.
Available options:
-
For a week — summary statistics for the last 7 days
-
yyyy-mm-dd — data for a specific date (available for the last 7 days)
CPU Load
The "CPU Load" tab displays the processor load chart for the selected period.
This tab includes two charts:
CPU Load chart
Shows the percentage of CPU utilization throughout the day. The scale ranges from 0 to 100%.
The chart helps identify peak loads and periods of increased activity.
When hovering over the chart, a tooltip appears with detailed information:
- Exact time of measurement
- Total CPU load percentage
- List of processes causing the load, with their individual contribution percentages
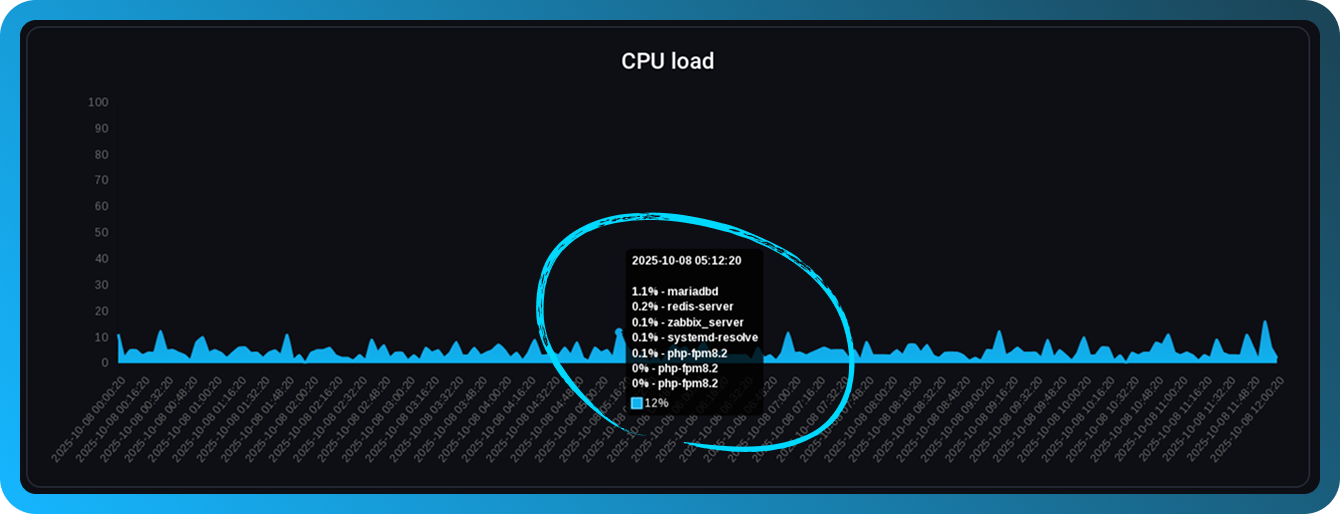
This allows you to quickly determine which processes or applications are responsible for high CPU usage at any given moment.
Load Average (LA) chart
Displays the system’s average load over three time intervals:
-
LA1 (blue) — average load over 1 minute
-
LA5 (light blue) — average load over 5 minutes
-
LA15 (red) — average load over 15 minutes
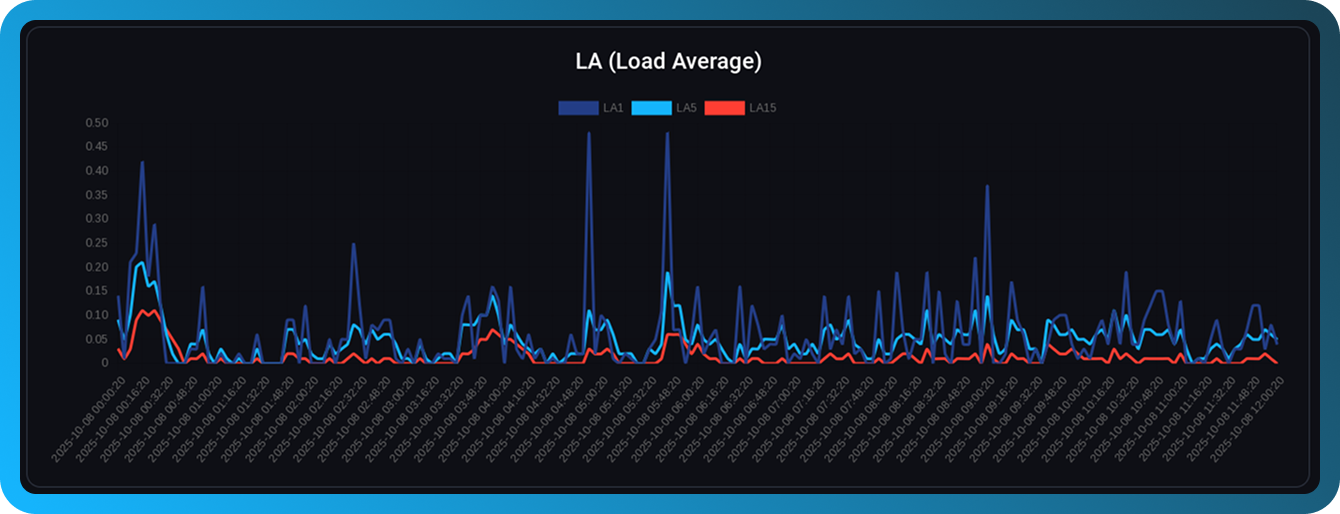
Load Average shows the number of processes waiting to be executed. A value higher than the number of CPU cores may indicate system overload.
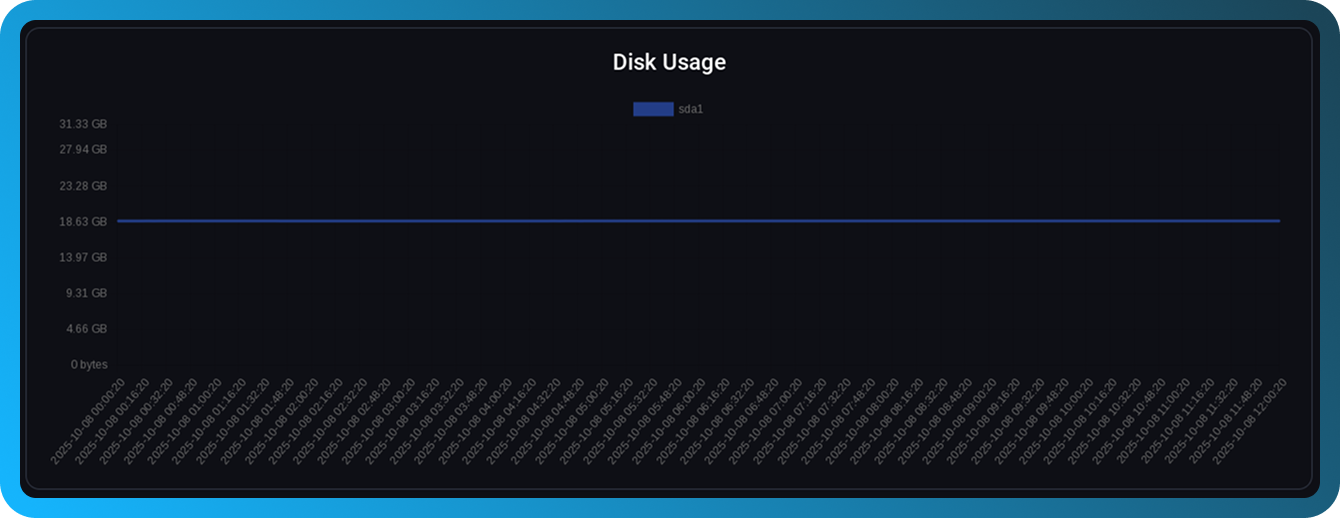
Disk Usage
The "Disk Usage" tab provides information about used disk space.
This tab contains two charts:
Disk Usage chart
Shows the amount of used disk space over the selected period. The scale is measured in gigabytes (GB).
The chart helps track the growth dynamics of disk usage
Inode Usage chart
Displays the number of used inodes (file index descriptors).
Each file and directory in the file system occupies one inode
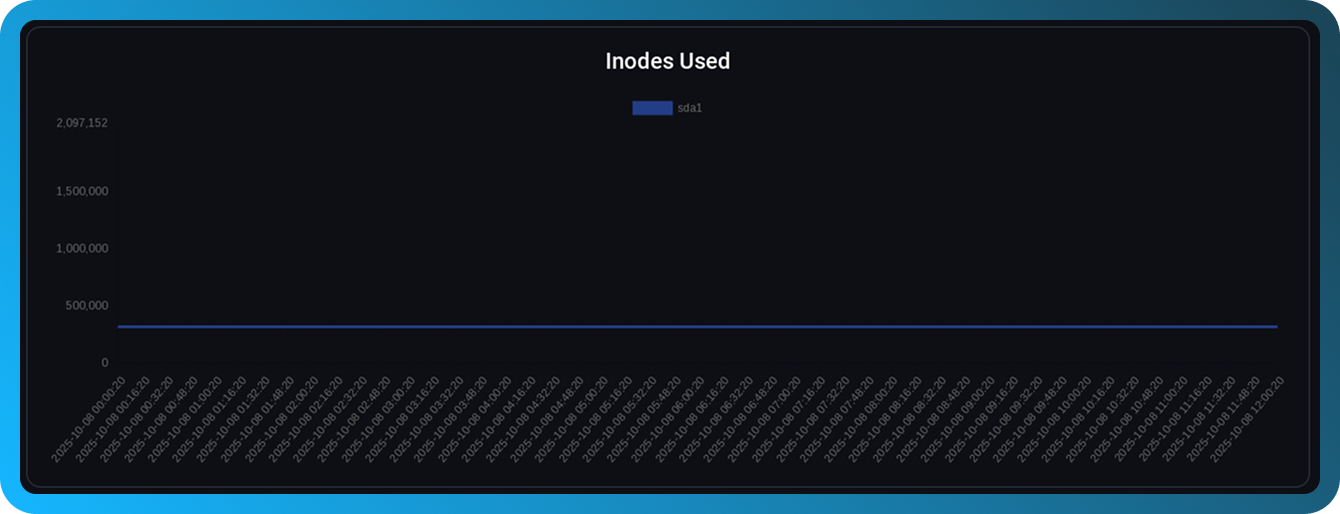
Even if free disk space is available, running out of inodes can prevent new files from being created.
Memory Usage
The "Memory Usage" tab shows the server’s RAM consumption.
The chart displays the amount of used RAM over the selected period.
The scale is shown in megabytes (MB) and gigabytes (GB)
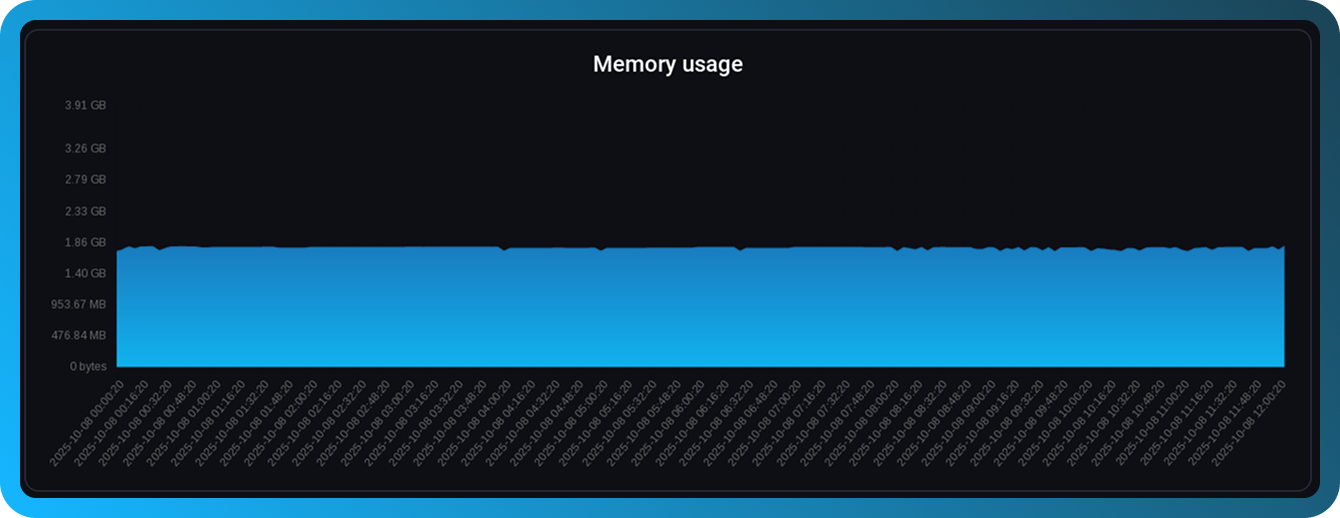
The chart allows you to:
- Determine average memory consumption
- Detect memory leaks
- Assess whether RAM needs to be increased
Interpreting monitoring data
Normal values
- CPU — sustained load below 70% is normal for most servers
- RAM — usage up to 80% is acceptable, but keeping a reserve is recommended
- Disk — at least 20% of free space should be maintained
Warning signs
- Constant high CPU load (over 90%) — may require application optimization or more processing power
- Constant near-maximum memory usage — risk of system instability, consider increasing RAM
- Rapid disk usage growth — cleaning or expanding disk space may be needed
- Inode exhaustion — remove unnecessary files or revise data storage structure
Monitoring recommendations
- Regularly check server statistics, especially after configuration changes
- Pay attention to unusual load spikes — they may indicate problems or attacks
- Use weekly statistics to analyze overall trends
- When planning new websites or applications, consider current resource utilization