Logs
Introduction
Analyzing site logs allows to audit its work and use the statistics for various purposes.
FASTPANEL® provides a special module to view access logs and error logs, and there is also a log analyzer module – AWStats.
Setup
To setup log options:
- Go to a site card
- Select "Settings"
- Open "Log settings" menu
In this menu you can configure the following options:
- Enable/disable site access logging
- Enable/disable logging of site errors
- Choose the number of log files stored after rotation
- Site logs rotation periodicity
How to view site logs?
To view site logs open "Logs" section in the Site card
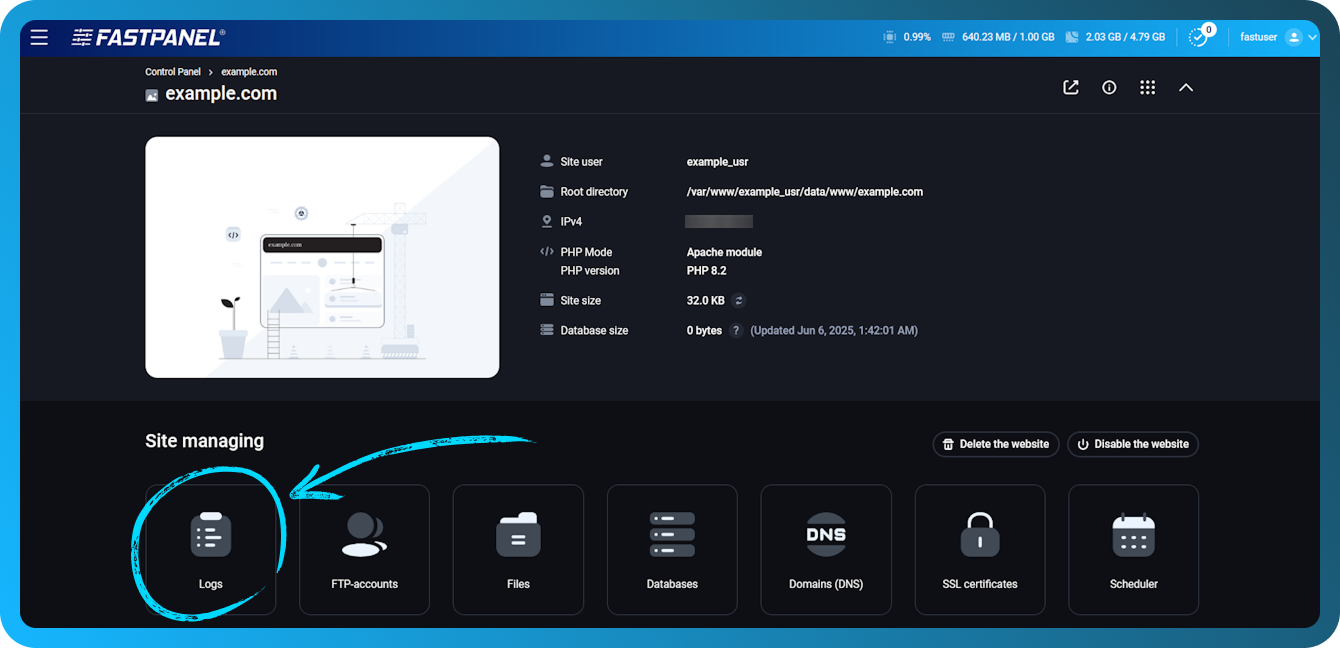
This section contains access and error logs for frontend and backend servers. Each log has its own tab:
- Frontend access log (Nginx)
- Frontend error log (Nginx)
- Backend access log (Apache, PHP-FPM)
- Backend error log (Apache, PHP-FPM)
Is there any tool to work with statistics?
FASTPANEL® provides the AWStats application, which allows you to generate visual reports on site visits based on automatic analysis of website logs.
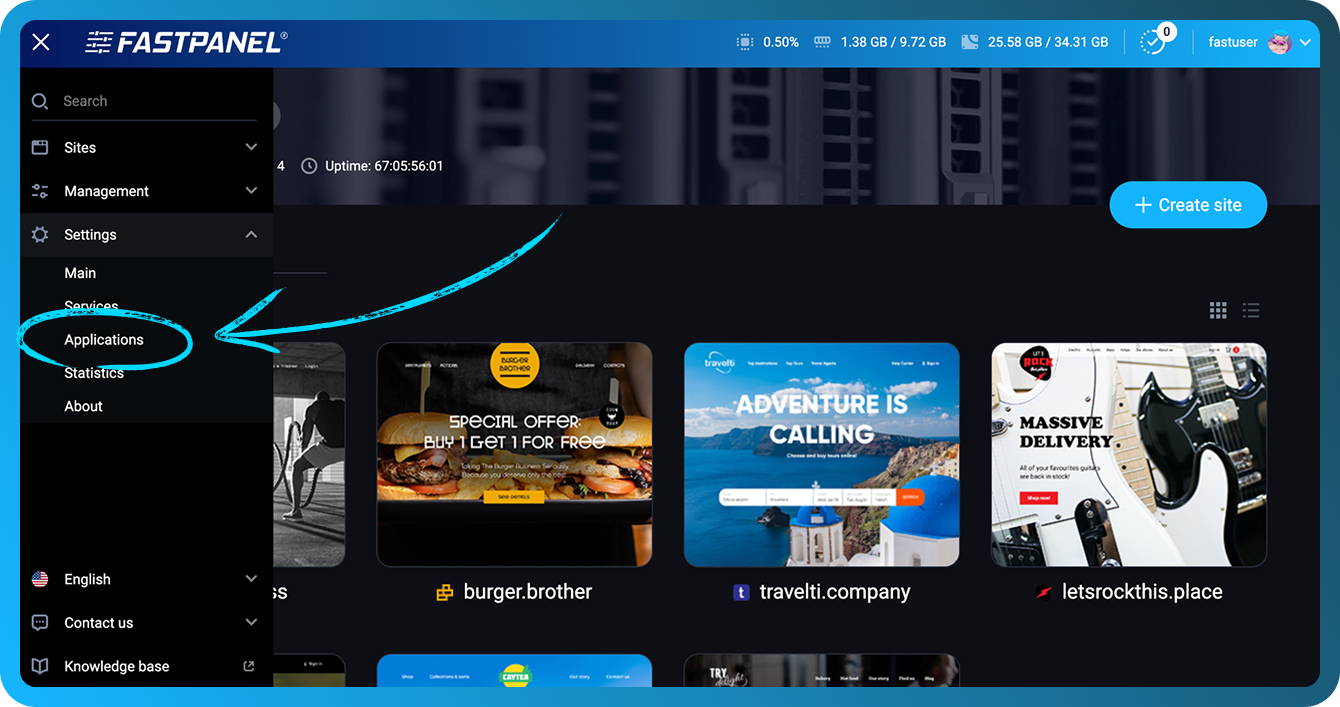
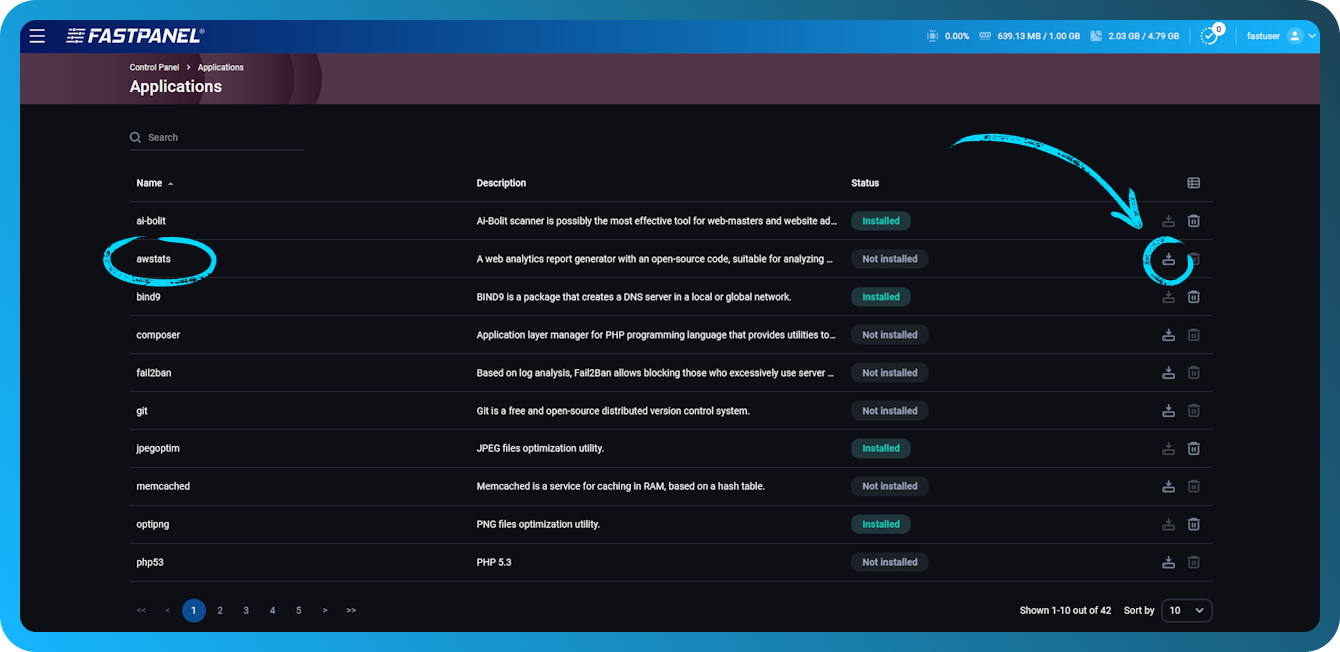
To use AWStats make sure to install it via the "Applications" menu
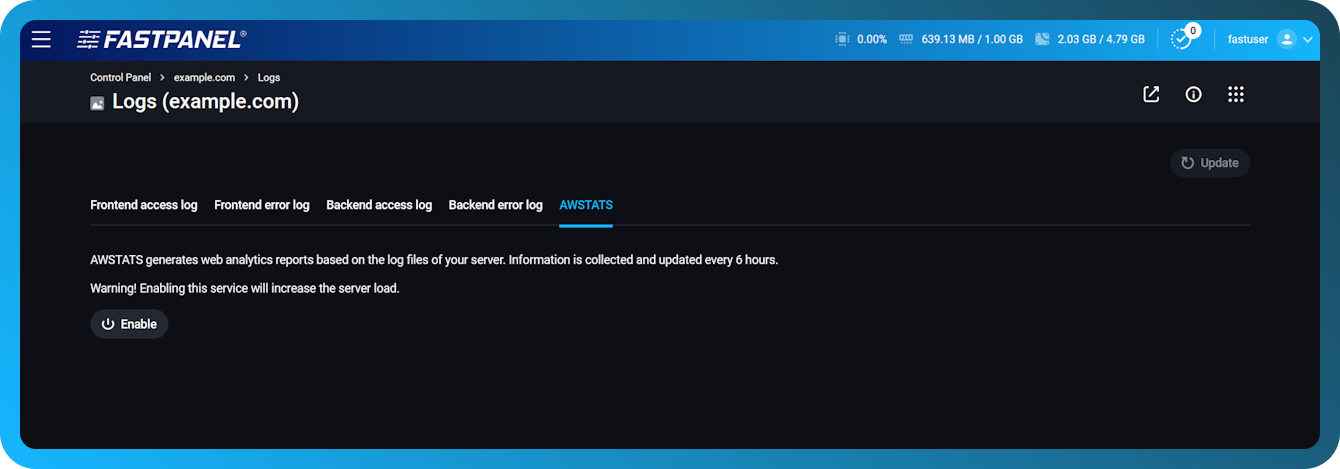
After it is installed, "AWSTATS" tab will appear in "Logs" section.
This tab allows to enable or disable the periodic report generation. When enabled, reports will be generated every 6 hours. After a report is generated, it can be opened. Moreover, you can run logs checking and report generation out of schedule, manually.